Table of Contents
What Is the S&P 500 Index?
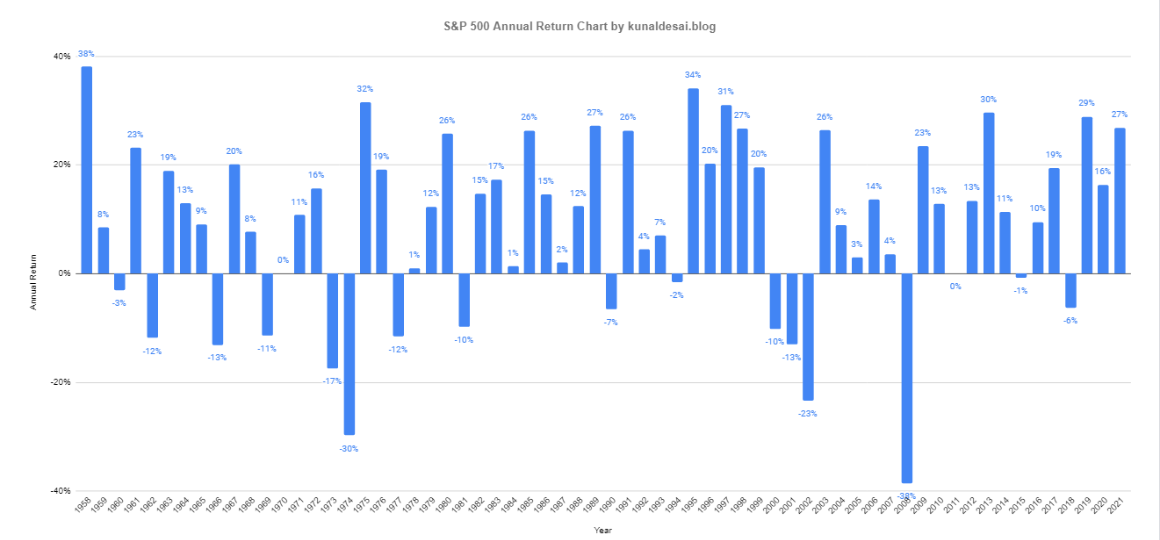
The S&P 500 is a list of the 500 largest publicly traded companies in the U.S. It’s organized by Standard & Poor’s Dow Jones Indices, which is part of S&P Global. It started as a smaller index in the 1920s and grew to its current size and name in 1957. On average, it has returned about 9.90% annually since 1928 and 10.26% annually since 1957.
The average annual return (AAR) is a percentage that indicates how much a mutual fund has earned over a specific period. It’s an important way to measure a fund’s performance over the long term, which is valuable for investors who are considering investing in a mutual fund.
S&P 500 Historical Annual Returns
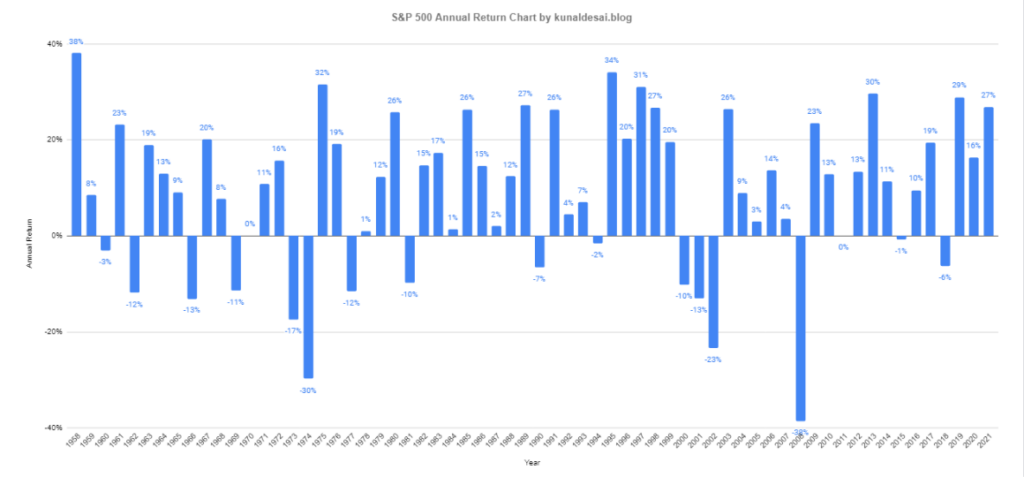
The History of the S&P 500
- In the first ten years since its launch in 1957, the index saw significant growth, reaching just above 800, driven by the post-World War II economic boom in the United States.
- Between 1969 and 1981, the index slowly decreased, dropping below 360, which indicated high inflation during that period.
- During the 2008 financial crisis and the Great Recession, the S&P 500 dropped by 56.8% from October 2007 to March 2009.
- After recovering from the crisis, the S&P experienced ten years of growth, increasing by 330% from 2009 to 2019.
- The S&P 500 dropped by more than 15% due to the COVID-19 pandemic in 2020 and the following economic downturn.
- The S&P 500 bounced back in the latter part of 2020, hitting numerous record highs in 2021. However, it experienced a significant drop of over 1,500 points in 2022 before recovering in October 2023.
S&P 500 Historical Returns
| Year | Annual Returns With Dividends |
|---|---|
| 1995 | 37.20% |
| 1996 | 22.68% |
| 1997 | 33.10% |
| 1998 | 28.34% |
| 1999 | 20.89% |
| 2000 | -9.03% |
| 2001 | -11.85% |
| 2002 | -21.97% |
| 2003 | 28.36% |
| 2004 | 10.74% |
| 2005 | 4.83% |
| 2006 | 15.61% |
| 2007 | 5.48% |
| 2008 | -36.55 |
| 2009 | 25.94% |
| 2010 | 14.82% |
| 2011 | 2.10% |
| 2012 | 15.89% |
| 2013 | 32.15% |
| 2014 | 13.52% |
| 2015 | 1.38% |
| 2016 | 11.77 |
| 2017 | 21.61 |
| 2018 | -4.23 |
| 2019 | 31.21% |
| 2020 | 18.02% |
| 2021 | 28.47% |
| 2022 | -18.01% |
How Inflation Affects S&P 500 Returns
Inflation presents a major challenge for investors aiming for a consistent average return of 10.13%. The historical average annual return drops to about 6.37% when adjusted for inflation. However, there’s uncertainty about the accuracy of this inflation-adjusted average because it relies on inflation figures from the Consumer Price Index (CPI), which some experts argue underestimates the true inflation rate.
CPI vs. S&P 500 Annual Returns
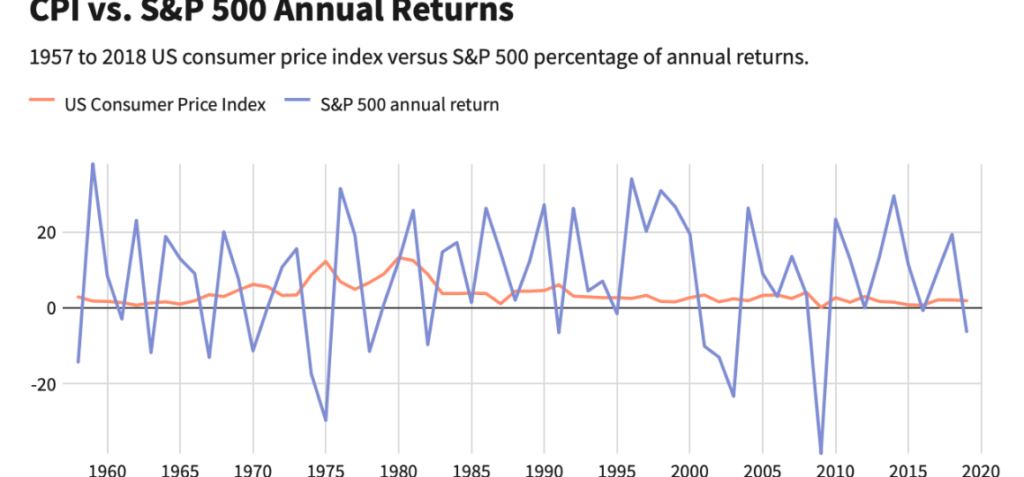
CPI data as of June 30, 2022. S&P 500 data as of July 18, 2022.
Source: Macrotrends and Federal Reserve Bank of St. Louis. Get the data. Add this chart to your site.
How Market Timing Affects S&P 500 Returns
One big thing affecting how much money you make from investing in the S&P 500 is when you start. Take the SPDR S&P 500 ETF Trust (SPY), which copies the index. You likely did well if you bought it between 2014 and 2018. But you might not have made as much money if you bought it between 2020 and 2023. When you invest, it matters a lot!
Investors who buy when the market is down and hold onto their investment or sell when it is up tend to make more money than those who buy when the market is high, especially if they sell during downturns. Timing your investments can lead to bigger returns!
Important: It’s not a good idea for new investors to try timing the market.
Buying stocks matters how much you make, but predicting when markets will be low or high is hard. If you’re worried about missing out when markets are down but don’t want to risk trading a lot, dollar-cost averaging can help.
SPDR S&P 500 ETF Price History
You can find the daily price history of SPDR S&P 500 ETF Trust (SPY) since it started in 1993.
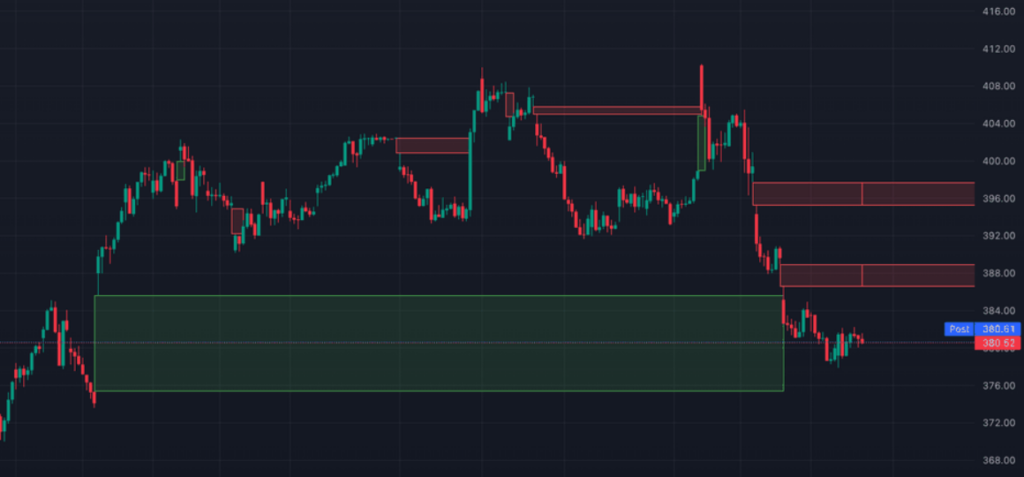
Source: MacrotrendsGet the dataAdd this chart to your site
How to Invest In the S&P 500
You can’t buy the S&P 500 because it’s not a single stock or fund. However, you can invest in S&P Global (SPGI) stock, which manages the index. Another option is to buy every stock listed on the S&P 500, which requires a lot of money. For example, buying just one of each of the top 10 stocks on the index might cost around $3,000.
The easiest and cheapest way for most people to invest in the S&P 500 is by buying shares of an exchange-traded fund (ETF) or index fund that copies it. These funds contain a mix of stocks that match the S&P 500 index. They’re offered at a lower cost than buying all the stocks individually to achieve similar results.
To start investing in the index, you must open an account with a trusted brokerage firm like Vanguard, Fidelity, or Charles Schwab. These brokers have user-friendly online platforms where you can buy and sell investments with very low or no fees.
Next, check out the brokers’ investment options and find an ETF or index fund that tracks the S&P 500. Some examples include:
- The SPDR S&P 500 ETF (SPY)
- The iShares Core S&P 500 ETF (IVV)
- The Vanguard S&P 500 ETF (VOO)
- The Invesco S&P 500 Equal Weight ETF (RSP)
- The Schwab S&P 500 Index Fund (SWPPX)
- The Fidelity 500 Index Fund (FXAIX)
FAQs
1. What has been the average rate of return for the S&P 500 for the last 20 years?
Ans: Between 2003 and 2023, the S&P 500 had an average yearly return of 10.20%.
2. What has been the average rate of return for the S&P 500 for the last 10 years?
Ans: Since 2013, the S&P 500 has had an average annual return of 13.05%.
3. Does the S&P 500 Return Include Dividends?
Ans: S&P 500 returns typically don’t include dividends. However, some analysts, like NYU Stern School of Business finance professor Aswath Damodaran, provide results that do.
The Bottom Line
The S&P 500 is the benchmark for gauging overall market performance. It’s seen numerous highs and lows throughout its hundred-year history, but overall, it’s delivered returns over the long haul. Since it started, it has provided a return of 9.81%.
You can invest in the S&P 500 using index funds and exchange-traded funds (ETFs) that copy the index, and you won’t have to spend as much as buying each stock individually. Investing in these funds is a long-term strategy and not for those who are easily scared—some investors have lost everything by selling in a panic during a downturn. If you’re seeking an investment with a solid history of good long-term returns, S&P 500 funds could be a good fit for your investment portfolio.
Trade on the Go. Anywhere, Anytime
Get ready to trade on one of the biggest crypto exchanges in the world! Enjoy low fees and great customer service while trading safely. With Binance, you can easily check your trade history, manage auto-investments, view price charts, and make conversions without fees. Sign up for free now and join millions of traders and investors in the global crypto market.


